Flow Field Analysis of a DN75 Globe Valve at Different Flow Velocities
Abstract: DN75 globe valves used in power plant piping systems are susceptible to several failure modes during long-term operation, including erosive wear, vortex-induced vibration and associated structural fatigue, and cavitation damage. In this study, a three-dimensional numerical model of the valve's entire flow passage was developed using computational fluid dynamics (CFD) principles and the finite element method (FEM) to investigate the internal turbulent flow field at different inlet velocities. The analysis focused on the following aspects:
- Pressure and velocity field distributions and their evolution with inlet velocity.
- Vorticity distribution within the valve.
- Pressure distribution on the bottom surface of the valve plug.
- Mechanisms responsible for the formation of local high- and low-pressure regions in the throttling zone.
- Cavitation risk in critical regions of the globe valve.
The results show that the inlet static pressure increases approximately linearly with inlet velocity, the highest flow velocities occur in the throttling gap, and vorticity increases markedly as inlet velocity rises. The sealing edges of the throttling orifice are also identified as regions at significant risk of cavitation. These findings provide a technical basis for optimizing valve design, improving resistance to erosion and cavitation, and ensuring safe and reliable operation.
Globe valves are widely used in power plant thermal systems and water supply and drainage pipelines to regulate flow and pressure, owing to their short operating stroke, reliable sealing performance, and stable control characteristics. Their internal flow behavior directly affects operational reliability, control accuracy, and service life. DN75 globe valves are commonly used in auxiliary water circulation, condensate transport, and chemical makeup water systems in power plants. During operation, changes in unit load can cause substantial fluctuations in pipeline flow velocity, leading to significant changes in the internal flow field. These changes can result in several problems, including:
- Pressure fluctuations in the throttling zone.
- High-velocity erosion.
- Vortex-induced vibration.
- Cavitation damage.
- These issues can compromise the long-term safety and stability of power plant piping systems.
Advances in computational fluid dynamics (CFD) and finite element simulation have provided effective tools for investigating complex flow fields within valves. Compared with conventional physical experiments, numerical simulation can capture local flow characteristics in complex passages and reproduce the evolution of the flow field over time, while reducing research costs and shortening development cycles. Existing studies of globe valve flow fields have primarily focused on optimizing structural parameters under fixed operating conditions. However, further systematic investigation is needed to clarify how flow field parameters change under the variable flow velocities encountered in power plant operation. In particular, the relationships between flow velocity variations and internal pressure distribution, turbulent fluctuations, vortex development, and cavitation risk remain insufficiently understood.
Against this background, this study investigates a DN75 globe valve commonly used in power plants. A three-dimensional finite element simulation of the entire internal flow field is performed based on the governing equations for mass conservation, momentum conservation, and turbulent transport. The study focuses on the following aspects:
- Flow field characteristics: Analyzing the pressure and velocity fields and vorticity distributions at different flow velocities.
- Valve plug forces and cavitation risk: Evaluating the forces acting on the valve plug and investigating the mechanisms responsible for cavitation at the throttling orifice.
- Effects of flow velocity: Examining how changes in flow velocity affect the internal flow characteristics and energy losses.
- The findings provide a theoretical basis and practical guidance for optimizing operating conditions, enhancing erosion resistance, and ensuring the safe and reliable operation of DN75 globe valves in power plants.
The three-dimensional model of the DN75 globe valve was developed using SolidWorks 2022, and SolidWorks Flow Simulation was used to simulate the internal flow field. To ensure the accuracy and reliability of the results, the modeling and simulation process followed a systematic workflow involving the following steps:
- 3D modeling of the globe valve.
- Mesh generation for the computational domain.
- Mesh independence verification to assess the influence of mesh resolution on the results.
- Boundary condition specification based on the operating conditions.
- Simulation parameter configuration to define the computational settings.
- Numerical solution to obtain the flow field results.
Three-dimensional part and assembly models of the valve body, valve plug, and valve seat were developed in SolidWorks 2022 based on the nominal dimensions of the DN75 globe valve and its actual configuration in a power plant. The models were then simplified for subsequent flow field simulation. Interference checks confirmed that the components were free of interference and that the flow passages were unobstructed, ensuring that the simplified model met the design requirements (Figure 1).
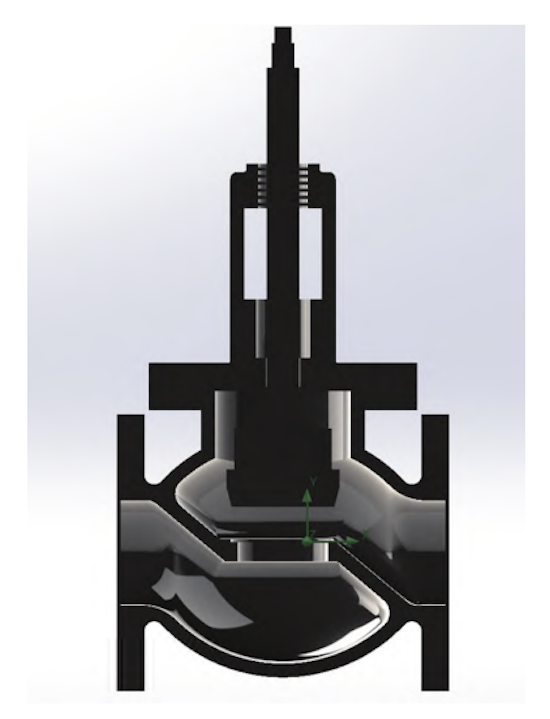
Figure 1. Three-dimensional part models of the globe valve
Mesh generation is a critical step in flow field simulation, as mesh quality directly affects the accuracy and convergence of the numerical solution. In this study, a tetrahedral mesh was generated using the meshing module in SolidWorks Flow Simulation. Tetrahedral elements can accommodate complex geometries and are therefore well suited to the irregular flow passages inside a globe valve. Because the flow field changes significantly in the narrow gap between the valve plug and valve seat, particularly in terms of velocity and pressure, local mesh refinement was applied to this region to capture the flow characteristics more accurately. To verify mesh independence, five mesh configurations with different element densities were generated and simulated under identical operating conditions. Key flow field parameters were then compared across the five configurations to assess the effect of mesh density on the simulation results (Figure 2).
As the mesh count increased from 197,375 to 246,872, the maximum pressure changed by 0.068 MPa. Increasing the mesh count further to 347,145 reduced the maximum pressure difference to 0.02 MPa relative to the 246,872-mesh case. Further refinement to 424,862 and 497,514 meshes resulted in negligible changes in the maximum pressure compared with the 347,145-mesh case, indicating that mesh independence had been achieved.
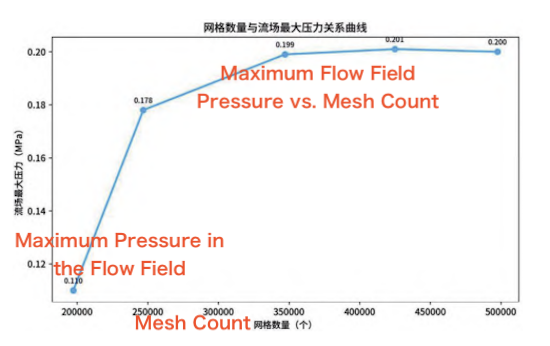
Figure 2. Maximum flow field pressure as a function of mesh count
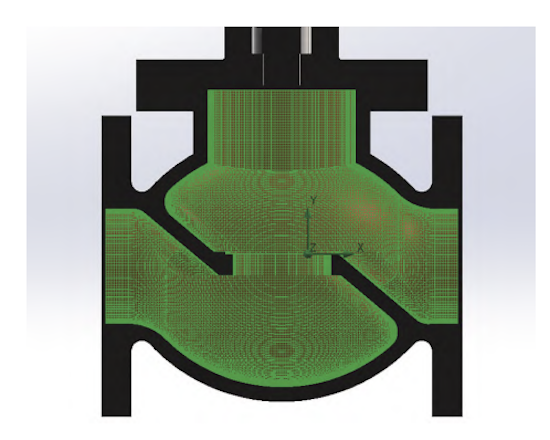
Figure 3. Mesh configuration of the globe valve
Considering both computational accuracy and efficiency, a mesh count of 347,145 was selected for subsequent simulations. This configuration provides sufficient accuracy without incurring the excessive computational time and resource demands associated with finer meshes. The relationship between mesh count and maximum pressure is shown in Figure 2, and the resulting mesh configuration is illustrated in Figure 3.
Based on the actual flow velocity range in power plant piping, four inlet flow velocities were investigated: 5, 10, 15, and 20 m/s. The flow direction was aligned with the axis of the valve inlet passage and perpendicular to the inlet plane. The outlet pressure was set to atmospheric pressure, allowing the fluid to exit freely. No-slip boundary conditions were applied to all solid walls, and the walls were assumed to be adiabatic, with no heat exchange between the fluid and the surrounding structure. Water was used as the working fluid, and the standard k-ε varepsilon turbulence model was selected. Convergence criteria were specified for all governing equations to ensure numerical convergence. Upon completion of the simulations, the following data were extracted for each operating condition:
- Pressure field.
- Velocity field.
- Vorticity distribution.
- Pressure distribution on the bottom surface of the valve plug.
Pressure and velocity contours, vector plots, and other flow field visualizations were then generated to facilitate the subsequent analysis.
Pressure distribution is a key indicator of the internal flow characteristics of a globe valve and directly influences cavitation risk, sealing performance, and service life. In this study, pressure contours were obtained for four inlet flow velocities to examine the pressure distribution patterns and their variation with flow velocity, as shown in Figure 4. Under all four operating conditions, the pressure decreases from the inlet toward the outlet. The most pronounced pressure variations occur in the narrow gap between the valve plug and valve seat and at the corner of the downstream flow passage. By contrast, the pressure distribution in the inlet and outlet passages remains relatively uniform, with no abrupt changes. The pressure contours also show a marked increase in pressure in the valve plug region as the inlet flow velocity increases. The inlet pressure is approximately 0.20 MPa at 5 m/s, 0.49 MPa at 10 m/s, 0.98 MPa at 15 m/s, and 1.70 MPa at 20 m/s. These results indicate a strong positive correlation between inlet pressure and flow velocity over the investigated range.
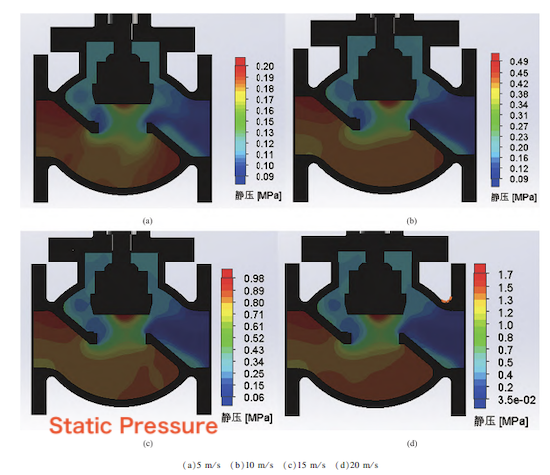
Figure 4 Cloud map of pressure distribution under four working conditions
The velocity field reflects the internal flow characteristics of a globe valve and is closely coupled with the pressure field. Its distribution influences the valve’s throttling performance, energy losses, and potential erosion locations. In this study, velocity contours and vector plots were obtained at four inlet flow velocities to examine the overall velocity distribution, identify regions of rapid velocity change, and compare the flow characteristics under different operating conditions. The resulting velocity fields are shown in Figure 5.
Under all four operating conditions, the most pronounced velocity changes occur in the narrow gap between the valve seat and valve plug, where the highest velocities are observed within the flow passage. At an inlet velocity of 5 m/s, the fluid velocity remains relatively low and inertial effects are limited, allowing viscous forces to play a more significant role. Consequently, the velocity distribution is relatively uniform, with no pronounced local variations. At 10 m/s, the fluid accelerates sharply as it passes through the gap between the valve seat and valve plug, reaching a maximum velocity of 23.6 m/s. This indicates a stronger influence of passage geometry on the local flow field. At inlet velocities of 15 and 20 m/s, increased turbulent fluctuations lead to more irregular fluid motion and an expansion of the downstream recirculation region, resulting in a more complex flow pattern and higher local velocities. Overall, the velocity distribution is strongly influenced by the geometry of the flow passage. The fluid accelerates through constricted regions and decelerates in expanded regions, consistent with the continuity equation.
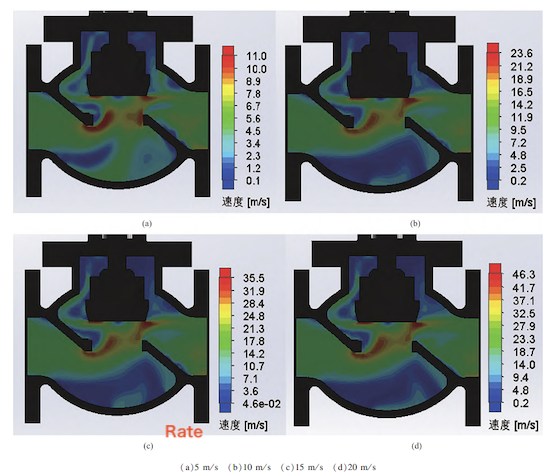
Figure 5. Velocity contours at inlet flow velocities of (a) 5 m/s, (b) 10 m/s, (c) 15 m/s, and (d) 20 m/s
Vorticity is a fundamental quantity describing the local rotational motion of a fluid. Its magnitude characterizes the intensity of fluid rotation, while its spatial distribution reveals the locations and extent of vortical structures within the flow field. Vorticity is also associated with flow energy dissipation and may influence valve vibration. Figure 6 shows the vorticity distributions under the four operating conditions.
At an inlet velocity of 5 m/s, the overall vorticity magnitude is relatively low, with higher values concentrated mainly at the corners of the flow passage. Under this condition, viscous effects are relatively significant, and the flow remains comparatively stable. Pronounced velocity gradients and irregular flow patterns are limited, resulting in weak rotational motion and a relatively small region of elevated vorticity. At an inlet velocity of 10 m/s, the vorticity magnitude increases significantly, and regions of elevated vorticity develop into continuous bands. Turbulent fluctuations and irregular fluid motion become more pronounced, promoting the formation of coherent vortical structures and further intensifying local rotation. As the inlet velocity increases to 15 and 20 m/s, regions of elevated vorticity expand further, reflecting increasingly complex flow structures and more vigorous interactions between adjacent fluid regions. The vortical structures become more pronounced, with higher vorticity magnitudes, a broader spatial distribution, and more clearly defined vortex cores.
Vorticity is concentrated primarily in the downstream flow passage, with particularly high values in the narrow gap between the valve seat and valve plug. Its distribution closely follows the velocity field, with elevated vorticity occurring in regions of rapid velocity change and flow direction deviation, where vortical structures are more pronounced. The vorticity is predominantly circumferential, indicating that rotational motion is mainly concentrated in the circumferential direction, consistent with the geometry of the globe valve flow passage. To mitigate valve vibration and reduce energy losses during power plant operation, controlling the flow velocity is an important measure. Further improvements may be achieved by optimizing the downstream flow passage, for example, by incorporating flow-guiding structures or smoothing passage bends. These modifications could suppress vortex formation, reduce local vorticity, and improve operational stability.
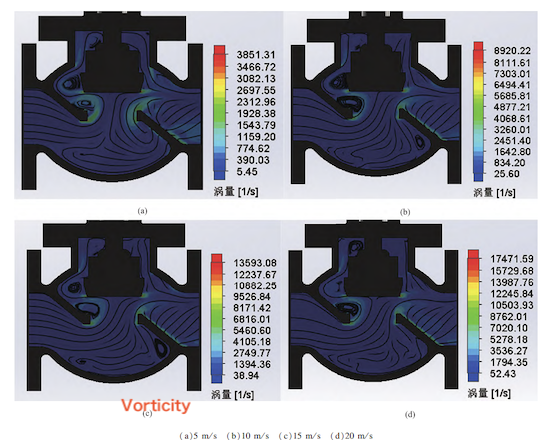
Figure 6. Vorticity distributions at inlet flow velocities of (a) 5 m/s, (b) 10 m/s, (c) 15 m/s, and (d) 20 m/s
The bottom surface of the valve plug is directly exposed to the fluid flow and subjected to fluid impact. Its pressure distribution affects the force balance and wear of the plug, as well as the valve’s flow regulation accuracy. Therefore, analyzing the pressure distribution on this surface is important for understanding the flow characteristics of globe valves. In this study, pressure data were extracted from the bottom surface of the valve plug under four inlet flow velocity conditions to investigate how flow velocity affects the pressure distribution. The results are shown in Figure 7.
Under all four operating conditions, the pressure distribution on the bottom surface of the valve plug is axisymmetric, with the highest pressure at the center and the lowest pressure near the periphery. Pressure decreases gradually from the center toward the edges, with a relatively small gradient in the central region and a steeper gradient near the periphery. At low flow velocities, the overall pressure on the bottom surface is relatively low because the fluid has less kinetic energy to transfer to the plug surface. As the flow velocity increases, the greater impact energy causes the central pressure to rise continuously. Meanwhile, intensified turbulent fluctuations increase energy dissipation as the fluid spreads toward the periphery, causing the peripheral pressure to rise more slowly than the central pressure. Consequently, the pressure difference between the center and the periphery increases, although the rate of increase gradually levels off.
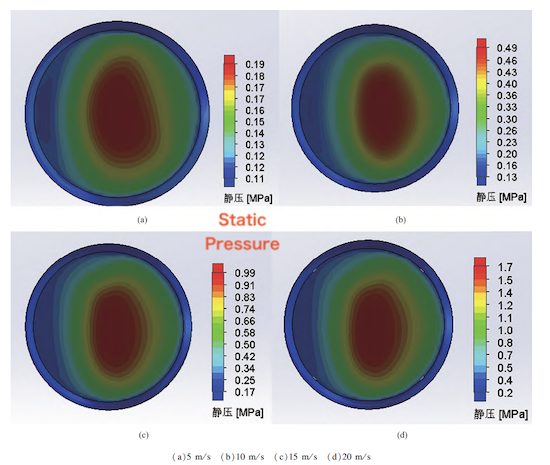
Figure 7. Pressure Distribution on the Bottom Surface of the Valve Plug Under Four Operating Conditions
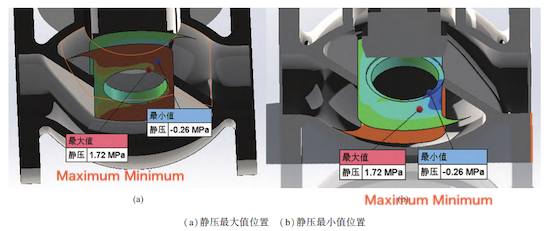
Figure 8. Static Pressure Distribution in the Entire Flow Field at an Inlet Velocity of 15 m/s
In addition, abrupt changes in flow cross-section across the valve cavity, throttling orifice, and downstream passage intensify energy transfer and conversion within the valve. As a result, the static pressure distribution becomes highly nonuniform, with distinct regions of maximum positive and negative pressure, as shown in Figure 8.
At an inlet velocity of 15 m/s, the maximum static pressure in the flow field reaches 1.72 MPa, occurring at the edge of the lower surface of the valve seat, as shown in Figure 8(a). As the high-speed incoming flow moves from the valve cavity toward the throttling orifice, the flow area contracts sharply, restricting the flow path and increasing the momentum change along the flow direction. Consequently, the fluid exerts a strong impact force normal to the valve seat wall. The edge of the valve seat’s lower surface also forms a local stagnation zone, where the incoming fluid is obstructed by the wall and its velocity decreases significantly, resulting in a local rise in static pressure. The right-angled geometry of the seat edge further intensifies flow impingement and stagnation, contributing to the pressure peak. This region is therefore critical for structural strength assessment and erosion-resistant design.
The minimum static pressure in the flow field is −0.26 MPa, with the lowest-pressure region concentrated at the sealing contact edge between the valve plug and valve seat, as shown in Figure 8(b). As the fluid passes through the narrow throttling orifice between the plug and seat, the flow area reaches its minimum and the flow velocity increases sharply. Downstream of the orifice, the sudden expansion of the flow passage promotes rapid flow deceleration and pressure recovery. However, the strong conversion between static and dynamic pressure within the throttling region causes a substantial local drop in static pressure.
In addition, the abrupt change in passage geometry downstream of the orifice can cause boundary layer separation and the formation of a localized vortex near the plug–seat contact edge. The high tangential velocity within the vortex core is associated with a marked reduction in static pressure, contributing to the minimum pressure observed in the flow field.
According to cavitation theory, when the local static pressure falls below the saturated vapor pressure of the fluid, vapor bubbles form in the low-pressure region. Dissolved gases may also come out of solution, contributing to bubble formation. As these bubbles are carried downstream into a higher-pressure region, they may collapse rapidly, generating high-speed microjets and pressure waves. This process can cause repeated cavitation erosion of the sealing surfaces of the valve plug and seat, compromising sealing performance and shortening service life. Bubble formation and collapse can also induce pressure fluctuations within the flow field, potentially leading to structural vibration and flow-induced noise. These effects can undermine the stable operation of globe valves at high flow velocities.
This study uses numerical simulation to investigate the full flow field of a DN75 globe valve at four inlet flow velocities. The effects of inlet velocity on the internal flow characteristics are analyzed, leading to the following conclusions:
(1) Inlet flow velocity is a key factor governing the internal flow field of the DN75 globe valve, with major flow parameters closely related to changes in velocity. As the inlet velocity increases, turbulent fluctuations intensify and vortex structures develop and interact, resulting in increasingly complex flow patterns and greater energy dissipation.
(2) Abrupt changes in flow cross-section produce a highly nonuniform static pressure distribution, with distinct regions of maximum and minimum pressure. The high-pressure region near the lower edge of the valve seat is associated with flow impingement and stagnation, making it a critical area for structural strength assessment and erosion-resistant design. The low-pressure region near the plug–seat sealing interface may be susceptible to cavitation, which can damage sealing surfaces and compromise valve integrity.
(3) The pressure distribution on the bottom surface of the valve plug is approximately axisymmetric, with the highest pressure at the center and the lowest near the periphery. As the inlet velocity increases, the central pressure rises more rapidly than the peripheral pressure, increasing the pressure difference across the surface. This variation affects the load distribution on the valve plug and may influence flow regulation accuracy and operational performance.