Impact of Valve Stem Surface Roughness on Packing Sealing Performance: Test Results and Analysis
May 14, 2025
The friction and leakage data recorded after 200 reciprocating movements of globe valve stems with varying surface roughness are presented in Table 1. In the table, positive friction values indicate the stem being pulled out of the stuffing box, while negative values indicate the stem being pushed in. The friction variation curves for the four packing types under different stem roughness levels are shown in Figure 7.
According to the test data in Table 1, Packing Type C exhibited the lowest friction across all levels of stem roughness, with a minimum value of 1.09 kN, indicating that its design effectively reduces friction. In contrast, Packing Type D showed the highest friction, reaching up to 6.86 kN, which could increase operational resistance and negatively affect the valve’s ease of operation.
Table 1 Friction and Leakage Rate of Globe Valve Stems with Different Roughness After 200 Movements
|
Roughness (Ra, µm) |
Packing Type |
Positive Friction (kN) |
Negative Friction (kN) |
Leakage Rate (Pa·m·s⁻¹) |
|
0.2 |
A |
6.18 |
-7.15 |
2.7 × 10⁻⁵ |
|
B |
4.91 |
-5.04 |
2.3 × 10⁻⁵ |
|
|
C |
2.23 |
-2.45 |
2.1 × 10⁻⁵ |
|
|
D |
6.86 |
-6.61 |
2.1 × 10⁻⁵ |
|
|
0.4 |
A |
5.45 |
-5.55 |
2.1 × 10⁻⁵ |
|
B |
3.70 |
-3.89 |
2.1 × 10⁻⁵ |
|
|
C |
1.09 |
-1.09 |
2.1 × 10⁻⁵ |
|
|
D |
5.36 |
-5.42 |
2.1 × 10⁻⁵ |
|
|
0.8 |
A |
6.23 |
-6.61 |
2.2 × 10⁻⁵ |
|
B |
3.22 |
-3.23 |
2.1 × 10⁻⁵ |
|
|
C |
1.43 |
-1.55 |
2.1 × 10⁻⁵ |
|
|
D |
5.71 |
-5.89 |
2.2 × 10⁻⁵ |
|
|
1.6 |
A |
5.61 |
-5.63 |
3.1 × 10⁻⁵ |
|
B |
2.98 |
-2.99 |
2.2 × 10⁻⁵ |
|
|
C |
1.84 |
-1.87 |
2.1 × 10⁻⁵ |
|
|
D |
5.76 |
-5.34 |
2.1 × 10⁻⁵ |
|
|
3.2 |
A |
5.01 |
-4.85 |
2.2 × 10⁻⁵ |
|
B |
3.53 |
-3.46 |
2.1 × 10⁻⁵ |
|
|
C |
2.50 |
-1.88 |
2.1 × 10⁻⁵ |
|
|
D |
4.89 |
-4.78 |
2.3 × 10⁻⁵ |
The test results show that when the stem roughness is 0.4 µm, the leakage rate remains stable at 2.1 × 10⁻⁸ Pa·m³/s, representing the best sealing performance. In contrast, the leakage rates at other roughness levels fluctuate between 10⁻⁷ and 10⁻⁸ Pa·m³/s. Although stem roughness does have an impact on the leakage rate, within a certain range, its influence on sealing performance remains relatively limited.
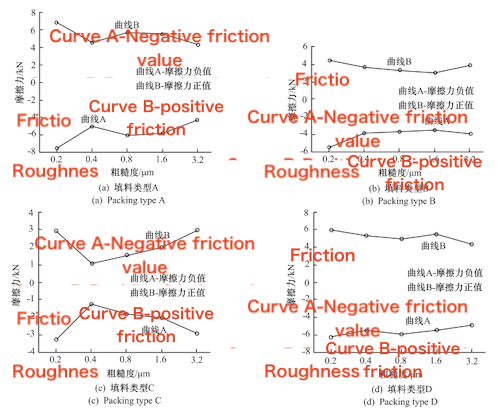
Figure 7 Friction Variation Curve of Four Different Packings Under Various Valve Stem Roughness Levels
The test data indicate that the ball valve shows the lowest leakage rate at a roughness of 1.6 µm, with a value of 2.1 × 10⁻⁸ Pa·m³/s, suggesting that this roughness provides the best sealing performance. The highest leakage rate, 6.4 × 10⁻⁸ Pa·m³/s, occurs at a roughness of 0.2 µm, which may result from uneven sealing contact due to an excessively smooth surface. A moderate roughness, such as 1.6 µm, can promote more stable contact between the packing and valve stem, thereby effectively reducing leakage.
Under different roughness conditions, the torque of the ball valve varies significantly. For example, with packing type C, the lowest torque is 21.47 N·m at a roughness of 0.4 µm, indicating that lower roughness can reduce friction and operating torque. In contrast, the highest torque for packing type C is 32.32 N·m at a roughness of 1.6 µm, likely due to increased friction caused by the rougher surface. Selecting a moderate roughness can optimize performance by lowering friction and reducing torque requirements.
Among all tested packings, packing type C exhibits the lowest operating torque, 21.47 N·m, suggesting minimal friction and easier valve operation. On the other hand, packing type A shows the highest torque, 89.73 N·m, indicating greater friction and operating resistance. In practical applications, low-friction packing materials, such as type C, should be selected to minimize operating torque and improve both performance and user comfort.
Table 2 Torque and Leakage Rate Under the Stem of Ball Valves with Different Roughness After 200 Rotations
|
Roughness (Ra, µm) |
Packing Type |
Positive Torque (N·m) |
Negative Torque (N·m) |
Leakage Rate (Pa·m·s⁻¹) |
|
0.2 |
A |
84.85 |
-84.43 |
2.5 × 10⁻⁸ |
|
B |
45.18 |
-45.42 |
3.1 × 10⁻⁸ |
|
|
C |
28.37 |
-26.65 |
3.1 × 10⁻⁸ |
|
|
D |
60.24 |
-59.99 |
6.4 × 10⁻⁸ |
|
|
0.4 |
A |
67.89 |
-67.04 |
2.8 × 10⁻³ |
|
B |
33.07 |
-33.33 |
3.7 × 10⁻³ |
|
|
C |
21.47 |
-22.46 |
2.8 × 10⁻⁸ |
|
|
D |
65.67 |
-66.65 |
2.1 × 10⁻⁸ |
|
|
0.8 |
A |
75.73 |
-80.37 |
4.1 × 10⁻³ |
|
B |
48.87 |
-48.82 |
2.1 × 10⁻⁸ |
|
|
C |
32.31 |
-31.10 |
4.5 × 10⁻⁸ |
|
|
D |
59.49 |
-59.74 |
2.1 × 10⁻⁸ |
|
|
1.6 |
A |
89.73 |
-83.75 |
2.1 × 10⁻⁸ |
|
B |
44.62 |
-45.18 |
2.1 × 10⁻⁸ |
|
|
C |
32.32 |
-32.34 |
2.1 × 10⁻⁸ |
|
|
D |
114.97 |
-99.94 |
3.0 × 10⁻⁸ |
|
|
3.2 |
A |
87.13 |
-90.02 |
2.4 × 10⁻⁵ |
|
B |
41.70 |
-42.20 |
3.5 × 10⁻³ |
|
|
C |
22.34 |
-22.96 |
2.5 × 10⁻³ |
|
|
D |
58.02 |
-58.74 |
2.4 × 10⁻³ |
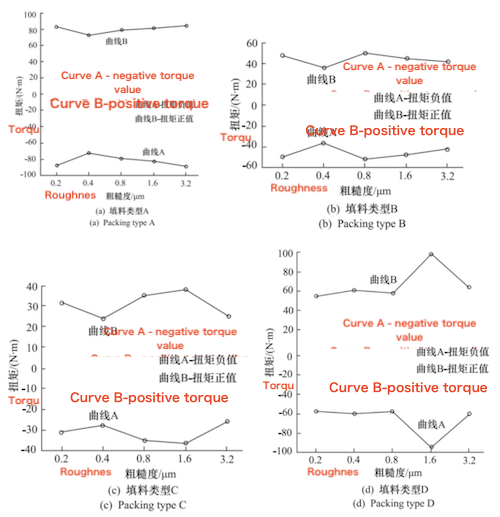
Figure 8: Stem torque variation curves for four types of packing under different stem roughness
In general, both the roughness of the valve stem and the packing type significantly affect the performance of the ball valve. When the roughness is 1.6 µm, the leakage rate is the lowest, providing the best sealing effect. Conversely, when the roughness is 0.4 µm, the operating torque is the lowest, indicating minimal friction. Among the different packing types, packing type C exhibits the lowest operating torque and friction, while packing type A exhibits the highest operating torque and friction. A comprehensive analysis indicates that selecting packing with moderate roughness and low friction helps optimize both sealing performance and operating efficiency of the ball valve.
This study systematically analyzed the effects of stem roughness and packing type on valve sealing performance. The results showed that the globe valve exhibited the best sealing performance and lowest friction when the stem roughness was 0.4 µm, while the ball valve achieved the lowest leakage rate and best sealing effect at a roughness of 1.6 µm. Packing type C demonstrated the lowest friction and operating torque, making it suitable for applications that require high sealing performance and operating comfort. The test results indicate that both stem roughness and packing type significantly influence valve performance, providing a scientific foundation for valve design optimization. Future research should focus on conducting additional experiments under extreme conditions to verify the applicability of these findings, as well as exploring new packing materials and advanced surface treatment technologies to further enhance the sealing performance and durability of valves. This will help advance valve technology and improve the safety and efficiency of industrial systems.
Previous: How Stem Roughness Affects Valve Sealing
Next: Localization and Performance Optimization of Pneumatic Track Ball Valves for Marine Engineering
